15 Product Adoption Metrics: How to Measure Product Adoption in 2025

As a Product Manager, you already know that tracking the right product adoption metrics is essential. These insights reveal how users engage with your product, helping you make data-driven improvements that drive growth.
But not all adoption metrics are created equal or relevant at the same time. Measuring product adoption isn’t just about looking at a handful of stats in isolation. It’s about understanding when and why each metric matters across different stages of the user journey.
That’s what makes this guide different.
We’re breaking down the best product adoption metrics and mapping them to key user journey stages so you can measure product adoption with precision.
Let’s dive in. 🚀
What is a product adoption?
Product adoption happens when a user moves beyond signing up. They reach a key activation point, experience the value proposition of your product, and make it a regular part of their workflow.
Simply getting users through the door isn’t enough. Someone might download your app, create an account, or even start a reverse trial, and then ghost you. If they never come back, they haven’t adopted your product. True adoption means they’ve engaged with it meaningfully, integrated it into their routine, and see its ongoing value.
Product adoption usually happens after user activation, the moment when a user experiences the core benefit of your product for the first time. This is known as the wow moment (or aha moment).
Once a user has completed this action, they’re more likely to stick around and fully adopt the product.
As a Product Manager, your job is to guide users toward product adoption as quickly as possible. The faster they reach that moment of value, the more likely they’ll be to stay put.
Why should you measure product adoption metrics?
Product adoption metrics provide deeper insights than surface-level stats. They tell you not just how many people show up to the party but whether they’re actually sticking around to buy a drink.
Take signups, for example. If a million people create an account, download your app, and then never return, traditional metrics might still paint a rosy picture. But product adoption data reveals the truth: if users aren’t engaging beyond the first touch, your product isn’t landing the way it should.
Without that insight, you risk a false sense of security. Paid signups may look great on paper, but if users never reach their wow moment they won’t stick around for renewal.
Put simply? Product adoption metrics track behavior, making them invaluable for identifying pain points, testing assumptions, and spotting where users drop off. They help you:
1️⃣ Spot friction points: Understand where users struggle and why they disengage.
2️⃣ Refine your onboarding: Guide users to activation faster and more effectively.
3️⃣ Validate feature success: See which updates drive real engagement (and which don’t).
4️⃣ Align teams on priorities: Give product, customer success, and marketing a shared source of truth.
5️⃣ Prove long-term value: Adoption data is a powerful story for investors, showing not just traction but sustainable growth.
Ultimately, product adoption isn’t just about tracking usage—it’s about understanding what keeps users coming back so you can build a product that thrives.
15 product adoption metrics you should know
Most articles throw adoption metrics at you without much context. We’re not going to do that.
Instead, this list will follow the customer journey – so you’ll know not just what to track, but when to track it, depending on what insights you’re after.
From first touch to churn risk, here are the key stages:
🔹 Acquisition: Getting users to sign up or engage for the first time.
🔹 Activation: Ensuring they experience the product’s core value early.
🔹 Onboarding: Helping users learn how to navigate a product.
🔹 Engagement: Encouraging active usage of key features.
🔹 Adoption: Getting users to make the product part of their routine.
🔹 Retention: Keeping them engaged and coming back consistently.
🔹 Churn Risk: Spotting when users are disengaging and at risk of leaving.
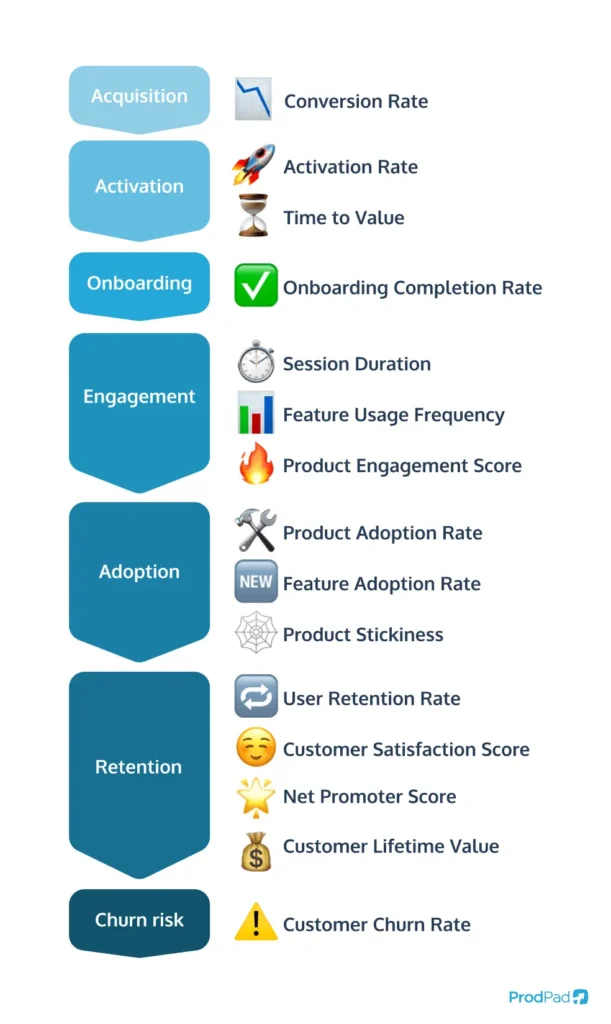
And now, here are 15 product adoption metrics: laid out in order of where they fit best in the journey, so you can track exactly what matters at every stage:
1. 📈 Conversion rate

Conversion rate measures the percentage of visitors who take a desired action. Essentially, it shows how successful you are at turning potential users into active customers.
The definition of a “converted user” can vary depending on the context. For example, in a free trial scenario, a conversion might be someone upgrading to the paid version. If you’re a Product Marketing Manager tracking the impact of a marketing campaign, a conversion could mean users who accessed your product through a promotion.
Why is conversion rate a great metric? Well, it directly reflects the effectiveness of your onboarding process, sales funnel, and marketing strategies. By understanding how many users are transitioning from interest to action, you can identify any friction points or opportunities for improvement in driving user adoption.
Ultimately, tracking this metric helps you assess how well you’re getting people through the door and getting them to stick around.
2. 🚀 Activation rate
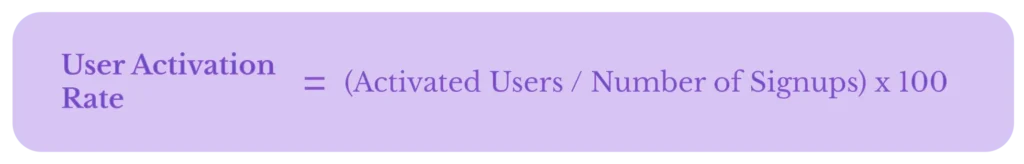
Activation rate measures the percentage of users who reach a specific activation threshold, which typically means they’ve experienced the core value of your product. This is a key indicator of user engagement and product fit, as it shows how many users get to the point where they truly understand the problems your product solves.
While conversion rate can measure various actions like trial-to-paid or marketing campaign responses, activation rate is specifically focused on the moment when a user has interacted with your product enough to reach that wow moment.
Activation rate is important because it highlights how effective your onboarding process is and whether users are able to quickly experience the value your product promises. A high activation rate typically leads to better retention and long-term engagement, making it a crucial metric to track as part of your overall adoption strategy.
Learn more about user activation and how to improve it:
3. ⌛ Time to First Value

Time to First Value (TTFV) measures how long it takes for a new user to experience their first meaningful benefit from your product. It’s a critical metric because the faster users see value, the more likely they are to continue engaging.
This is different from Time to Value (TTV), which tracks how long it takes for a user to gain full, long-term value from the product. TTFV focuses on the initial wow moment, whether that’s completing a key action, using a core feature, or achieving a small win.
A shorter time to first value means a smoother onboarding experience, leading to higher activation and retention rates. If TTFV is too long, users may drop off before realizing what makes your product valuable. Optimizing onboarding flows and reducing friction points can help users reach value faster, increasing overall adoption.
There’s a lot more to get into when it comes to Time to Value. Learn more:
4. ✅ Onboarding completion rate

The onboarding completion rate measures the percentage of users who complete your onboarding process. It’s a key indicator of how effective your onboarding experience is at guiding users toward activation and adoption.
A high onboarding completion rate means users are successfully navigating the steps needed to get started with your product. A low rate, on the other hand, signals friction, whether that’s down to a confusing setup process, too many steps, or unclear guidance.
Improving this metric is important because users who don’t complete onboarding are far less likely to stick around. Streamlining the process, reducing complexity, and offering in-app guidance can all help.
For more on user onboarding, check out our tips on how to give a product tour:
How to Build a Kickass Product Tour
5. ⏱️ Session duration

Session duration measures how long users actively engage with your product in a single visit. While looking at one user’s session length in isolation won’t tell you much, averaging session duration across all users or specific cohorts provides a clearer picture of engagement.
A higher average session duration often indicates that users find your product valuable and engaging, while shorter sessions may suggest friction, lack of interest, or difficulty navigating key features.
However, context matters. Long sessions aren’t always a good thing if they’re a result from users struggling to complete tasks.
Tracking session duration alongside other metrics, like feature usage or task completion rates, helps you understand how users interact with your product. If your session duration is lower than expected, consider improving UX, or adding in-app guidance to keep users engaged for longer.
6. 📊 Feature usage frequency

Feature usage frequency tells you how often users interact with specific features in your product. Usage frequency can be measured based on different timeframes. The right frequency metric depends on how often you expect users to engage.
Are you building a tool meant for daily use, or is weekly or monthly engagement more realistic? You have three primary options to focus on:
- DAU (Daily Active Users): Measures the number of unique users engaging with a feature daily. Ideal for products that rely on frequent engagement, like communication tools or social apps.
- WAU (Weekly Active Users): Tracks the number of users who interact with a feature at least once per week. This is useful for products where regular, but not necessarily daily, usage is expected, like project management tools.
- MAU (Monthly Active Users): Measures unique users who engage with a feature over a month. Best for products with less frequent usage, like subscription-based platforms or financial tools.
Tracking the right feature usage frequency helps you understand engagement patterns and identify opportunities to improve stickiness and retention.
7. 🔥 Product engagement score (PES)

The Product Engagement Score (PES) is a combined metric that gives you a more complete picture of how well users are adopting and engaging with your product. Rather than looking at individual numbers in isolation, PES brings together three key metrics:
- Product Adoption Rate: Measures how many new users are actively adopting your product over time.
- Product Stickiness: Compares daily or weekly active users to monthly active users, showing how frequently users return.
- Product Growth Rate: Tracks how fast your user base is expanding.
By combining these three data points, PES provides a high-level engagement snapshot that helps teams quickly assess overall performance. A strong score suggests users are not only trying your product but sticking with it and spreading the word. If your PES is low, it’s a sign to dig into the individual metrics to uncover areas for improvement.
Here’s more on product engagement score:
8. 🛠️ Product adoption rate
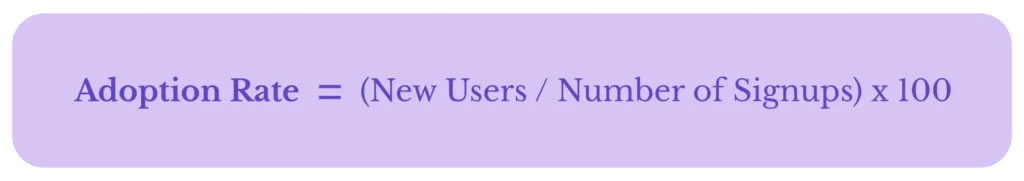
Product adoption rate measures the percentage of new users who go beyond signing up and start actively using your product. It’s a critical metric for understanding how successful you are at turning interest into sustained engagement.
A high adoption rate means users are quickly seeing value and integrating your product into their workflow. A low rate suggests friction in onboarding, unclear value propositions, or gaps in feature usability.
Tracking the adoption rate helps teams identify bottlenecks and optimize the user experience. If you want more users to stick around, focus on reducing time to first value and refining your core feature set.
9. 🆕 Feature adoption rate

Feature adoption rate is like product adoption rate’s more detail-oriented sibling. Instead of measuring overall product adoption, this metric focuses on how many users are actively engaging with a single feature.
Tracking feature adoption helps you understand which features are resonating and which are being ignored. If a new feature isn’t getting traction, it could signal issues with discoverability, usability, or value perception.
To improve feature adoption, you need to make a new feature stick by implementing strategies like in-app guidance, tooltips, and email nudges that highlight its value. The more effectively you introduce and integrate new features, the higher your chances of driving long-term engagement. If you want to learn more about feature adoption rate – and its brother product adoption rate for that matter – we’ve got an in-depth deep dive on both:
10. 🕸️ Product stickiness

Product stickiness tells you how often users return to your product within a given timeframe. The key here is choosing the right timeframe based on how frequently you expect users to engage.
For products designed for daily use you’ll want to track Daily Active Users (DAU) ÷ Weekly Active Users (WAU). This helps measure whether users keep coming back day after day.
For less frequently used products Weekly Active Users (WAU) ÷ Monthly Active Users (MAU) is a better fit. This tells you whether users are consistently engaging over longer periods.
A high stickiness rate means your product is valuable and habit-forming. A low rate could signal friction in the user experience or a lack of compelling reasons for users to return.
11. 🔁 User retention rate

User retention rate measures the percentage of users who continue using your product over a given period. It’s a key indicator of how well your product delivers ongoing value and whether users find it worth sticking with.
A high retention rate means users are engaged and see your product as essential. A low retention rate, on the other hand, could signal issues with user experience, lack of value, or competition pulling users away.
To improve retention, focus on delivering continuous value and addressing pain points before users churn. Tracking retention alongside other metrics like product stickiness (which we’ve just mentioned) and churn rate (we’ll get to that) gives you a clearer picture of long-term user engagement.
Learn more about user retention:
12. ☺️ Customer satisfaction scores
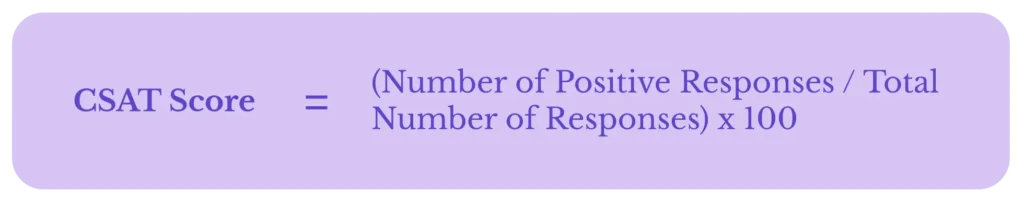
Customer Satisfaction Score (CSAT) is a straightforward way to gauge how happy users are with your product. It’s calculated by asking users to rate their experience and determining the percentage of positive responses.
But what’s a positive response? Well, say in your survey you ask to get rated out of 5. All your scores of 4 and 5 can be considered a positive response.
CSAT helps you quickly assess user sentiment, identify pain points, and improve areas of your product that might be falling short. Since it relies on direct user feedback, it’s an essential tool for keeping a pulse on customer happiness. If you want to boost your CSAT, start by learning how to collect customer feedback in 2025.
Collecting Customer Feedback in 2025
13. 🌟 Net Promoter Score (NPS)

The Net Promoter Score (NPS) is a key customer experience metric used to measure customer loyalty. It asks users how likely they are to recommend your product or service to others, using a scale from 0 to 10.
Scores of 9-10 are considered “Promoters,” people who are enthusiastic about your product and likely to spread the word. Scores of 0-6 are “Detractors,” users who are unhappy and may hinder growth. Those in the middle (7-8) are “Passives,” and while they are satisfied, they don’t directly influence your NPS score.
By calculating the NPS, you get a clear picture of your customer’s loyalty and satisfaction, helping to identify areas for improvement and strengthen customer relationships.
14. 💰 Customer lifetime value (CLV)

Customer Lifetime Value (CLV) is a metric that helps you understand the total revenue a customer is likely to generate for your business during their relationship with your product or service. It gives you a clear picture of how much each customer is worth in the long run, helping you make more informed decisions on customer acquisition and retention strategies.
To calculate CLV, you’ll need two other key metrics:
- Customer Value: This is calculated by multiplying the average purchase value by the purchase frequency. In other words, how much does each customer spend per transaction and how often do they make a purchase?
- Average Customer Lifespan: This measures the average duration a customer remains active with your business, either in years or months. It gives you an idea of how long customers typically stick around.
Once you have these figures, you can multiply them to calculate your overall CLV. Understanding CLV allows you to make data-driven decisions about marketing spend, customer retention efforts, and overall growth strategies, ensuring you prioritize long-term value over short-term gains.
15. ⚠️ Customer churn rate

Customer churn rate measures the percentage of customers who stop using your product or service over a specific time period. It’s an essential metric because it helps you understand how well you’re retaining customers and if there are any underlying issues driving users away. A high churn rate may indicate dissatisfaction with your product, poor user experience, or stronger competition, while a low churn rate suggests you’re successfully meeting customer needs.
By tracking churn, you can identify patterns or pain points in your product or customer experience that need attention. Lowering your churn rate is key to long-term success, as retaining existing customers is often more cost-effective than acquiring new ones.
Learn more about customer churn:
How do I choose the right product adoption metrics?
You don’t need to track every adoption metric under the sun. In fact, tracking too many can lead to information overload, making it harder to get actionable insights. Instead, you should focus on the few that best align with what you’re trying to learn.
But how do you whittle it down?
Every metric on our list is useful, but not all will be useful right now. The key is to choose metrics based on what you want to uncover. Specifically, the metrics you choose need to help you answer:
- Who is adopting your product?
- What features do they love?
- When does adoption happen?
- How long do adopted users stay?
And because no two products are the same, the best metric for one company may not be as relevant for another. That’s why your objectives dictate which metrics matter most.
For example:
- If your goal is to improve activation, you should focus on Activation Rate over PES.
- If you’re trying to increase feature engagement, tracking Feature Adoption Rate makes more sense than measuring Session Duration.
- If your priority is long-term retention, then Customer Retention Rate will tell you more than CSAT scores.
By aligning your metrics with your goals, you ensure that what you’re measuring actually helps you make informed decisions – without drowning in data.
You’ll also likely find that your current objectives will focus your attention on a specific part of the customer journey. This is why this list has been structured this way, as it can help you pinpoint the best metrics for your main aim.
- Early journey: If you’re focused on getting users in the door and experiencing value quickly, metrics like Conversion Rate and Activation Rate will tell you if your onboarding is working.
- Mid-journey: If you want to ensure users are integrating your product into their workflow, Feature Adoption Rate and Product Stickiness (DAU/WAU/MAU) show how often they return.
- Late journey: If your goal is to reduce churn, you’ll want to monitor Customer Retention Rate and Churn Rate to catch disengaged users before they leave.
By aligning metrics with the customer journey, you’re not just collecting data—you’re getting the right insights at the right time.
Want to know more about matching metrics with your objectives – check out our free OKR Course 👇

How do I measure product adoption metrics?
Chosen your key product adoption metrics? Great. Now let’s talk about how to measure them effectively.
How often should I measure product adoption metrics?
The frequency depends on the metric. Some adoption metrics, like Sign-Up Rate or Activation Rate, should be tracked daily or weekly to spot trends early. Others, like Feature Adoption Rate or Customer Retention Rate, may be better suited for monthly or quarterly reviews to see long-term patterns.
A good rule of thumb: Shorter cycles for early-stage adoption, longer cycles for retention and churn.
Where do I measure product adoption metrics?
Tracking adoption requires product analytics tools, platforms that integrate with your product to monitor user behavior, feature usage, and engagement. These tools let you:
- See trends across your entire user base (e.g., how many users activate per week)
- Drill down into individual user journeys (e.g., where a specific user drops off in onboarding)
- Customize dashboards and reports to match your product’s unique goals
The best product analytics tools are easy to use, flexible, and packed with insights. If you’re looking for recommendations, check out our list:
7 Best Product Analytics Tools for Your Product Management Stack
Who is responsible for measuring product adoption metrics?
The Product Manager is typically the main person responsible for gathering and analyzing product adoption metrics. They track these metrics to understand how users engage with the product, identify barriers to adoption, and prioritize improvements.
However, product adoption isn’t just a Product Manager’s job, multiple teams rely on these insights to optimize their own strategies:
- Product Teams use adoption data to refine onboarding, improve UX, and prioritize feature development.
- Customer Success Teams leverage adoption insights to identify struggling users, offer proactive support, and reduce churn risk.
- Marketing Teams track which acquisition channels bring in the most engaged users and refine their messaging to attract more of them.
- Sales Teams use adoption data to highlight key benefits, handle objections, and showcase product value to potential customers.
Since product adoption metrics affect nearly every aspect of the business, cross-team collaboration is essential. The best results come when teams share adoption data and align their strategies to improve the overall user experience.
What do I do after measuring product adoption?
Measuring adoption is just the start: the real value comes from using that data to drive action. Once you’ve gathered insights, you should:
1️⃣ Identify friction points: Where are users dropping off? What’s stopping them from fully adopting the product?
2️⃣ Experiment & iterate: Test different onboarding flows, feature prompts, or engagement nudges to improve adoption rates.
3️⃣ Segment your users: Compare adoption metrics across different user groups to see who’s thriving and who needs help.
4️⃣ Align your roadmap: Use adoption data to prioritize improvements that will have the biggest impact on retention.
By continuously measuring and acting on product adoption metrics, you’re not just tracking success, you’re actively driving it.
Measuring for success
That list of product adoption metrics should keep you occupied for a while, and narrow down the metrics that are worth tracking – but crucially only when they match your objectives.
Don’t see this list as the 15 product adoption metrics you need to track. It’s more of a catalog of metrics that you can choose from. And now, you should know how to choose which ones best suit you.
Now, this list only covers product adoption metrics. There are a hell of a lot more wider product metrics and KPIs that you need to be aware of. Well, good job that we’ve gathered all the worthwhile ones and put them into this nice, easy-to-read eBook.
Download it now and learn which metrics you should have in the back of your mind:
