North Star Metric Examples to Kickstart Your Thinking
Every Product Manager knows all about metrics and KPIs. Heck, you’re probably tracking some right, out the corner of your eye while reading this. Well, you’re going to want to pay attention for a second, as we’re going to go through some North Star metric examples: THE most important metric for your business and your product.
By exploring various North Star metric examples, you should get a better sense of what a good one looks like so that you and your team can craft one for yourself. Your North Star is your guiding light – the metric that if you hit, you’ll almost guarantee revenue growth through your product performance.
Of course, a North Star metric will look different depending on your industry and product type. Despite being customer-focused, a B2B SaaS tool is going to have different goals from a luxury shopping app. To help you get a sense of what a good North Star looks like for your product, we’ve picked out six of the best to represent a bunch of different product types.
Let’s dig in, and take a look at some great North Star metric examples, and what makes them so great.
We’ll cover:
How do you define a North Star metric?
How do you choose your North Star metric?
North Star metric examples for different types of products
How do you define a North Star metric?
A North Star metric is essentially the single metric that every team in your entire company strives to achieve. It’s a customer-focused metric and should be one that if you hit it, you’ll be able to drive revenue growth and product success. It’s the key measurement that guides a company’s product strategy by clearly connecting customer value to business growth. This vital metric helps align Product Teams and more around a common goal, ensuring that efforts are focused on what truly matters for long-term success and avoiding the pitfalls of dangerous vanity metrics.
Got it? If not, we have a deep and detailed glossary article on North Star metrics that covers EVERYTHING you need to know about them. Check it out if you want to learn more, like why it’s important, how to set one for your own product, and how to properly measure it.
Glossary Definition: North Star Metric
How do you choose your North Star metric?
Not to catch you out, but if you’ve read our North Star metric glossary article, you’ll already know how to set this key metric. Seriously, we have a whole dang infographic on that.
Keeping things light here, the most important thing you need to know is that choosing a North Star metric boils down to defining a metric that connects customer value to business growth. If it sounds like we’re repeating ourselves, that’s ‘cause we are! Your North Star metric revolves around this idea, so it’s worth saying twice.
There are many questions you can ask yourself to help you land on the perfect North Star metric example for you, but it really all simmers down to these three must-haves:
1. Has to reflect customer value: Your North Star needs to capture the essence of what users value most about the product. That’s why many North Star metric examples are related to user activation, tracking the occurrence of the vital customer action that gets them hooked.
2. Has to be measurable: There’s little point having a North Star metric that you can’t measure in your product data. It needs to be something tangible and quantitative. Sure, improving customer satisfaction is a good goal to have, but it’s harder to measure reliably than something based on their actual use of your product. So better to choose a weekly usage statistic as your North Star and use that as an indicator of customer satisfaction.
3. Has to focus on long-term success: Rather than focusing on short-term gains, the best North Star metric examples signal ongoing engagement and loyalty. You’re tracking this metric for the long haul for sustainable growth, it’s not a short-term hyperfixation for a specified length of time.
North Star metric examples for different types of products
Now it’s time to get into what you came for – some real-world North Star metric examples. Getting a sense of what successful businesses choose for their North Star can help you figure out the best one for you.
That said, there is one important rule: don’t copy these North Star metric examples word for word. Doing so won’t make you magically have a good one yourself. That’s because North Star metrics are super personal. They relate heavily to each individual business. Your North Star needs to relate to your product vision, not someone else’s.
Now that you’ve been warned not to copy someone else’s homework, let’s take a look. We’ve broken things up into different product types to help you understand how the market and types of customers affect your overall product goals.
Business software
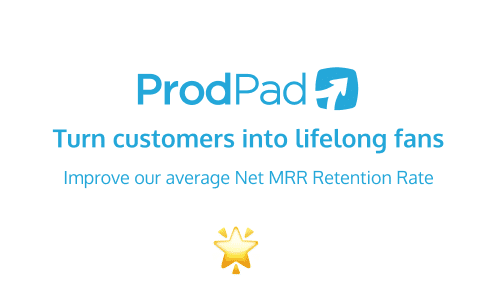
Hey look, that’s us! If we’re going to be analyzing North Star metric examples, we may as well start with us. Our North Star is all about customer retention, tracking Net MRR (Monthly Recurring Revenue) to ensure that what we’re doing entices users to stick around. And to pat ourselves on the back a bit, we’re doing a good job at that.
We love our North Star metric because of how it aligns all our teams to this customer-driven focus. It ensures that everyone in the product trio, plus Customer Success, Sales, and even Marketing is driven to provide great value in everything we do – be it a new feature release, product improvements, or customer support.
We want our users to be lifelong advocates of ProdPad. Kind of like a fan of a band from the 90s who’s still listening to their music 30 years later. This should be a goal of any form of B2B SaaS, as these types of products thrive on sustained usage, making a metric focused on MRR a good option. It shows that customers are finding continuous value with the product.
But enough about us, what are some other good North Star metric examples for business software? Some things you can track include:
- Feature engagement percentage: This measures how deeply users interact with key features, highlighting whether customers find real utility in the SaaS tool. For instance, if 70% of users are actively using a new feature, it’s a sign the feature hits the mark, and that customers are seeing the value in what you’re providing.
- Customer lifetime value (LTV): Tracking customer lifetime value allows SaaS businesses to understand the total revenue a customer generates throughout their relationship. This metric emphasizes the importance of retaining customers and enhancing the customer experience.
E-commerce
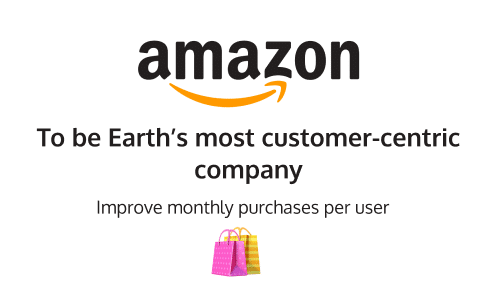
If we’re going to be talking about e-commerce, we can’t look beyond Amazon, the leading e-commerce business in the world – by a long shot. Amazon keeps an eye on purchases per month as their North Star metric.
This is a solid North Star metric example as it relates to the core action of an e-commerce product – buying products – but also gives them a glimpse into customer satisfaction. If users are increasing their purchases, then their satisfaction is clearly not on a downward trajectory.
Of course, Amazon tracks a lot of other key performance indicators alongside their North Star metric, and that’s something you should be doing too.
Remember, your North Star metric isn’t a replacement for tracking others KPIs, it’s just the one you care about the most – like a favorite child. In fact, you should track related KPIs that give your North Star some more context. For Amazon, they track things like average delivery times, the number of returned items, and more, which are all focused on their core mission – to be the most customer-centric business in the world.
As an e-commerce business, your goal for growth is to get users to continue buying from you time and time again. To that end, here are a couple more North Star metric examples you can focus on if you don’t vibe with Amazon’s:
- Returning customer rate: Tracking your returning customer rate is an insightful North Star metric for e-commerce products as it signals longterm customer loyalty and satisfaction. High returning customer rates shows that users enjoy the e-commerce experience and trust the brand, leading to predictable revenue growth.
- Average order value (AOV): AOV measures the average amount spent per transaction. Increasing this metric can indicate successful upselling or cross-selling strategies and helps gauge the effectiveness of promotions or product bundling. Higher AOV also directly impacts revenue without needing to get more customers.
Communication tools
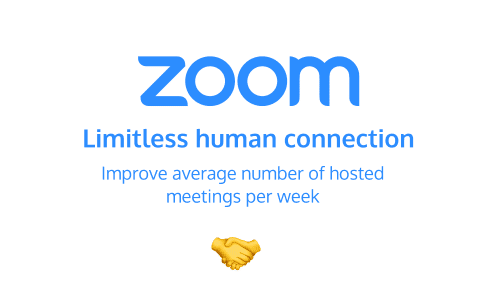
Zoom’s North Star metric is a powerful example fora communication tool, as it highlights the importance of identifying actions that reflect genuine user engagement. For Zoom, the focus on frequency – tracking the number of critical actions, like meetings or calls per week- enables them to gauge both product stickiness and user reliance. This is particularly important when you have a communication product, where long-term growth often hinges on consistent, habitual usage rather than occasional or one-time interactions.
Frequency-focused metrics like Zoom’s help track sustained engagement and user retention. By honing in on weekly active usage, Zoom captures a real-time snapshot of customer loyalty and satisfaction, which is crucial for adapting and responding to market needs. This also supports data driven Product Management: if the frequency drops, it could indicate a need for new features, improvements, or more effective customer support.
Additionally, Zoom’s approach aligns with the trend of Product-Led Growth (PLG), where the product itself drives user acquisition and retention. A frequency-based metric allows Zoom to pinpoint precisely how often users find value in their platform, shaping their growth strategies around improving those moments.
Some other great communication-focused North Star metrics include:
- Time spent in meetings/calls: Tracking the total time users spend in meetings or calls gives you insight into how well your product is meeting customer needs. A longer average suggests that users rely on your product for in-depth discussions or prolonged interactions, indicating strong engagement and utility.
- Time to value (TTV): Time to value tracks the time it takes for a new user to experience the product’s wow moment. Reducing TTV is critical for improving user onboarding and increasing conversion rates, as quicker value realization encourages users to engage more deeply with the product.
Collaboration tools

The value of collaboration products comes from users having other active teams to interact and work with. If that number is below your benchmark, they may not be getting the most value out of the product. That’s why tracking daily active users is such a useful North Star metric for Slack. It directly correlates to its goal of being an everyday utility for teams.
DAUs reflect engagement and reliability, showing how much teams depend on Slack for their workflows. By improving DAUs, Slack measures how effectively they make work-life easier and more connected, a critical element for a productivity tool aiming to boost collaboration.
Of course, there are other metrics collaboration tools can follow, such as:
- Daily messages sent per user: This product adoption metric measures how many messages each user sends daily, reflecting individual engagement levels. A higher average indicates that users are actively utilizing the platform for communication, which suggests that the tool is integral to their daily workflows.
- Average response time to messages: Measuring the average response time to messages can indicate how quickly users are communicating. A shorter response time suggests that the platform facilitates prompt interactions, which is crucial for effective collaboration and maintaining productivity.
Entertainment and media

Entertainment and media products will have slightly different North Star metric examples, more focused on total usage. Your goal is to keep users engaged with your product and to increase screen time, so Netflix’s North Star of total hours viewed is a great example. It’s a direct reflection of engagement. When people spend more time watching, it indicates they find value in the content. Hours viewed shows that users are not only engaging with Netflix but enjoying it enough to stay. This metric is ideal for Netflix, as it directly ties into their goal of being the go-to entertainment platform.
If your product is focused on written content, like Medium, you can augment this metric into something like ‘minutes spent reading per week.’ There are actually quite a lot of potential North Star metric examples that will work for media products. A few more include:
- Subscriber growth rate: Many media products use a subscription-based product pricing strategy, so tracking the growth rate of subscribers provides insight into the company’s ability to attract and retain paying customers. A consistent growth rate indicates strong demand for the content offered and effective marketing strategies.
- Content completion rate: This metric measures the percentage of viewers who finish watching or reading a piece of content, such as a movie, episode, or blog. A high completion rate indicates that the content is engaging enough to keep viewers interested from start to finish, which can inform product production decisions.
Hospitality and travel
For hospitality and travel products, things are a bit more unique. These apps must cater to users who are frequently on the move, seeking seamless, personal experiences that enhance their journey. They demand intuitive interfaces, quick access to essential information, and features that cater to both planning and in-the-moment needs. Ensuring high user engagement, a smooth user interface, and strong retention is key to making every interaction feel valuable to the customer.
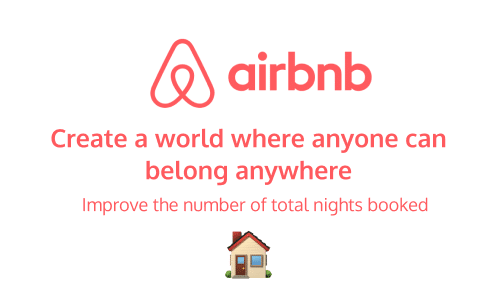
Tracking the number of nights booked is crucial for hospitality and travel products like Airbnb because it captures the platform’s effectiveness in meeting the needs of both sides of its marketplace: travelers and hosts. Each booking reflects not just the platform’s reach but its reliability and value, creating a direct link between user satisfaction and business growth.
Each night booked serves as a tangible indicator of entire marketplace trust. For travelers, it shows they trust the platform to offer secure, enjoyable, and unique accommodations. For hosts, it reflects trust in Airbnb’s ability to connect them with reliable guests. This trust is essential to Airbnb’s brand and long-term sustainability.
It also provides a good customer feedback loop. Nights booked offers a metric that reflects the overall user experience. High booking rates imply that users find value in the offerings, feel that the interface is intuitive, and trust the payment and communication systems. Tracking this metric can inform Airbnb of areas where experience can be further enhanced or optimized.
Of course, there are more things you can check out when looking for a North Star metric example for a hospitality and travel product. Other important metrics that can become your North Star include:
- Booking conversion rate: This tracks how many users go from browsing to booking, reflecting the product’s ability to convert interest into action. It’s a crucial North Star metric because it directly measures the app’s effectiveness in turning potential interest into actual revenue. A high conversion rate suggests that the app is successfully engaging users, providing relevant options, and simplifying the decision-making process.
- Time from search to booking: Shorter times suggest a smooth user experience, an intuitive interface, and successful personalization and recommendations, encouraging users to act quickly. A shorter booking time often means users aren’t facing barriers or confusion, which is key in travel where decisions may need to be quick and convenient.
Bad North Star metric examples
To help you create your North Star metric, it’s not enough to just see the best-in-class examples. It’s also worthwhile to see some bad ones so you know what to stay away from.
Now we’re not going to be cruel and highlight any real examples because we don’t want to pick on anyone. That’s not nice. Instead, here are some generic creations that you might see and why they suck.
If you’re reading these and notice a stark resemblance to your North Star metric, I don’t know what to tell you. You know what you need to do. These are the kinds of things you want to avoid.
Number of sign-ups
This is a pretty poor North Star metric as it only tracks the acquisition stage of the customer journey. This metric tells you next to nothing about how they’re using the product, and if they’re getting value from it.
Users may sign up and never return, making this an unreliable measure of how well your product is doing. Something better may involve tracking active users.
Number of free trial users
Oh boy, tracking something like this is a bad move. Yeah, free trials indicate the interest people have in your product, but again, it doesn’t let you see if users are finding the value in your product. And remember, it’s that value that drives success.
You may see a huge uptick in trials and think, great, people love our product, but that can be explained by a good marketing strategy or offers, not because your product rules. This metric doesn’t highlight long-term customer retention or engagement, which are crucial for growth.
Any vanity metric
To be honest, if you’re using vanity metrics as your North Star, you’re completely missing the mark. Website visitors, app downloads, and even feature usage counts won’t work because they fail to measure product value. These metrics are as hollow as a balloon. They can paint a rosy picture, but won’t inform you if your product is solving customer problems.
North Star metric examples – your role models
Your North Star metric serves as your torch in the dark. It shines a light on your product to help you align your strategies around a common goal and drive meaningful growth. This metric encapsulates what success looks like for an organization, focusing on user engagement, satisfaction, and long-term value. While it’s essential to look at industry-specific North Star metric examples for inspiration, it’s crucial to remember that these should serve as role models rather than exact blueprints.
Every business is unique, with its own goals, customer base, and challenges. Adopting a North Star metric that directly reflects your specific objectives will ensure that it resonates with your team and truly drives your success. Use these examples to ignite your creativity and spark new ideas, but tailor your metrics to suit your organization’s needs.
Define your North Star and let it guide your roadmap. If you’re ready to elevate the way you use product roadmaps, give ProdPad a try. Our free trial shows you how ProdPad streamlines planning, helps prioritize what truly matters, and keeps your entire team aligned with your North Star metric – all so you can build better products with confidence.
Give ProdPad a go today.