HEART Framework

What is the HEART framework?
The HEART framework gives you a structured approach to measuring and improving user experience (UX) in software products. Developed by Product Managers and UX Researchers at Google, it provides Product Teams with a clear way to assess how users interact with their product, focusing on five key experience-driven metrics.
It essentially gives you categories in which you can judge the overall quality and performance of your UX. It’s like in various Olympic Sports. Judges may score a snowboarding run out of 10, but what are they actually looking at that determines a good performance? Well, that score is broken down into subcategories like difficulty, execution, amplitude, and overall impression.
By breaking down what makes a good run (or UX design), you know what you need to work on to improve.
With the HEART framework, you’re taking a vague notion of ‘good UX’ and figuring out the elements of what constitutes good UX, as well as how to measure those elements. By using this framework, teams can move beyond gut feelings and anecdotal feedback to define success in terms of user behavior, satisfaction, and long-term engagement.
Here’s how Kerry Rodden, part of the team that introduced the HEART framework, defines it:
HEART helps teams break down the broad concept of “user experience” into more specific, measurable outcomes. It also encourages teams to consider multiple aspects of the user experience when defining metrics.
So what are the five metrics? Well, the acronym HEART stands for:
- Happiness 😊
- Engagement 🔥
- Adoption 🚀
- Retention 🔄
- Task Success ✅
Let’s break these all down to truly understand what we’re talking about here:
H- Happiness
Happiness measures how your user base feels about your product. This is a subjective but critical metric because a satisfied user is more likely to stick around, recommend your product, and engage with it over a period of time. Happiness metrics typically rely on user surveys and direct customer feedback loops to gauge user sentiment.
When quantifying happiness, we’re looking at overall user satisfaction, perceived ease of use, and loyalty. A product that frustrates or confuses users is unlikely to succeed, even if other metrics – like adoption – look strong initially. By understanding user sentiment, teams can identify pain points and opportunities for improvement.
Some common metrics to track happiness include:
- Net Promoter Score (NPS) – Measures how likely users are to recommend your product.
- Customer Satisfaction Score (CSAT) – Gauges how satisfied users are after completing an action.
- User sentiment surveys – Collects qualitative feedback on how users perceive the product.
E- Engagement
Engagement looks at how actively users interact with your product. Unlike retention, which measures whether users return, engagement focuses on how deeply and frequently they interact when they do return. A product with high engagement is likely to deliver value, while low engagement can signal disinterest or usability issues.
We want to see how often and in what ways users are engaging with our product. This helps us understand whether users find value and gives clues as to how UX can be improved.
Some common metrics for assessing engagement include:
- Daily/Weekly/Monthly active users (DAU, WAU, MAU) – Tracks how many users are actively engaging over different timeframes.
- Feature usage rate – Measures how often users interact with key features.
- Session length and frequency – Tracks how long and how often users spend time in the product.
A – Adoption
Adoption measures how many new users start using your product or a specific feature. This is a crucial metric for understanding growth and whether new features are resonating with users.
We’re focused on how easily new users onboard and how quickly they begin using core features. A high adoption rate suggests strong onboarding and a clear value proposition, while low adoption may indicate friction in the experience.
Common adoption metrics include:
- Signup rate – The percentage of visitors who create an account.
- Feature adoption rate – The percentage of users who try out a new feature after its release.
- Time to first key action – How long it takes new users to complete a meaningful interaction.
R – Retention
Retention measures how well a product keeps users coming back over time. Unlike engagement, which looks at usage depth, user retention tracks whether users return at all. High retention is a sign of a product that provides continuous value.
We want to understand how often users come back to our product after their initial visit. Strong retention means users are finding enough value to make your product a consistent part of their workflow or habits.
Some common metrics for retention include:
- Retention rate – The percentage of users who continue using the product after a set time period.
- Customer churn rate – The percentage of users who stop using the product.
- Returning users – A measure of how many users have used your product more than once in a pre-selected period of time.
To track retention of your users, you can also run cohort analysis to see how retention different based on different types of users. This can highlight if your UX isn’t resonating with a specific user persona. Check out our glossary post on cohort analysis to learn how to do it yourself:
T – Task success
Task success focuses on how efficiently and effectively users complete key actions within your product. This is particularly important for task-oriented products like search engines, productivity tools, or e-commerce platforms.
We’re tracking whether users can successfully complete tasks without frustration. A product that is difficult to navigate or prone to errors will have lower task success, leading to lower satisfaction, which indicates poor UX.
Some common metrics for task success include:
- Task completion rate – The percentage of users who successfully finish a task.
- Error rate – The frequency of failed actions or user mistakes.
- Time to completion – How long it takes users to complete a task.
🚨Word of Warning 🚨:
Although we’ve suggested some metrics to track for each part of the HEART framework, the reality is you’ll need to figure out what metric works best for you. You can’t just cover your eyes and pick one from the above. The metric you track needs to be relevant to you.
Thankfully we’ll cover that later on.
Who invented the HEART framework?
The HEART framework was developed at Google in 2010 by UX researchers Kerry Rodden, Hilary Hutchinson, and Xin Fu. They needed a way to help Product Teams move beyond vague “Is this good UX?” debates and instead track meaningful, user-centered metrics. So, they identified these five core HEART categories to focus on.
The idea was simple: UX isn’t just about making things look nice; it’s about making sure users are happy, engaged, and actually sticking around. With HEART, teams could break down the user experience into measurable chunks, track progress, and make data-driven Product Management decisions instead of relying on gut feelings.
The useful thing about HEART is that it’s designed to work at every level, whether you’re analyzing an entire product or just one key feature.
Instead of drowning in endless data, HEART helps teams focus on what really matters, making sure users aren’t just visiting, but actually loving the experience.
Why is the HEART framework important?
User experience can be tricky to measure. Sure, you can count sign-ups or page views, but do those numbers really tell you if people love using your product? Instead of drowning in vague metrics, Product Teams can focus on actionable insights that improve the overall experience.
“We’ve applied the HEART framework to a wide range of projects within Google, and we’ve found it a very useful tool for focusing discussions with teams. The acronym helps make it memorable, and it’s easy to facilitate an informal discussion by quickly writing the HEART categories on a whiteboard.”
Kerry Rodden, UX Research Consultant & HEART Framework Creator
In other words, HEART isn’t just a catchy acronym, it’s a practical tool that helps teams have meaningful conversations about UX, backed by real data.
The full list of benefits of the HEART framework includes:
- Clear focus: Helps teams zero in on key UX areas instead of tracking random data points.
- User-centric decisions: Puts user experience at the heart of product improvements.
- Measurable success: Turns abstract UX goals into trackable key metrics.
- Scalability: Works for both high-level product performance and specific features.
- Better team alignment: Provides a common language for discussing UX across teams.
- Actionable insights: Helps teams identify what’s working and what needs improvement.
Who should use the HEART framework?
Originally designed for UX teams, the HEART framework is a natural fit for anyone focused on offering a quality user experience. It helps User Experience Designers measure how people interact with a product and where improvements can be made. But it’s not just for UX teams.
Product Managers can (and should) use HEART to gain valuable insights into how their product is performing and identify opportunities for improvement.
For Product Managers, HEART isn’t just a measurement tool, it can also act as a prioritization model. By analyzing Happiness, Engagement, Adoption, Retention, and Task Success, PMs can weigh competing feature ideas and determine which initiatives will deliver the most strategic value.
Instead of relying on gut feelings and assumptions, they can use real user data to back up their product decisions, ensuring that development efforts are focused on what truly moves the needle.
Whether you’re optimizing UX, refining product strategy, or making a case for your next big feature, HEART helps teams focus on what really matters.
How do you follow the HEART framework?
The HEART framework is a great tool for focusing on the areas of UX that matter the most, but how do you turn the notions of ‘happiness’ and ‘task success’ into measurable, and more importantly, actionable metrics?
Well to do that and follow HEART, you also need to implement the Goals-Signals-Metrics process. This process is the HEART framework’s right-hand man, giving you steps to help you identify what you need to measure.
Coincidentally, Goals-Signals-Metrics was also developed at Google around the same time as HEART. It helps you translate high-level ideas from HEART into refined, trackable measurements. Here’s a step-by-step guide to using this approach in a way that keeps you focused and data-driven.
Step 1: Goals
When using the HEART framework, it’s easy to get a rush of blood to the head, and excitedly pick out metrics that suit each category. But before you even think about metrics, you need to get crystal clear on what you want to achieve for each part of HEART.
Start by defining broad, strategic goals that align with your user experience priorities and business objectives. These aren’t granular metrics; they’re the big-picture outcomes that your product or feature is aiming to deliver with its UX.
Keep your goals specific and actionable. For instance, rather than saying “increase user engagement,” refine that to “improve the experience of this feature so users engage with it more per session.” This clarity helps guide the rest of your process.
For a Product Management platform like ProdPad, a goal for the happiness section of the HEART framework might be:
“Improve user satisfaction with the roadmapping experience to reduce friction and increase feature adoption.”
Step 2: Signals
Once you have your goals for all HEART categories you want to determine what signals will indicate progress. These are observable user behaviors or attitudes that act as hints as to whether your goals are being met. These signals are the qualitative or quantitative insights that bridge the gap between abstract objectives and concrete actions.
Make sure to choose signals that are both easy to track with your existing tools and sensitive enough to reflect changes from your design tweaks. For example, instead of simply counting page views, consider tracking the time users spend on certain pages.
For the happiness goal above, a potential signal might be:
- Increased positive sentiment in user feedback about roadmap usability.
Step 3: Metrics
The final step of this process is converting those signals into precise, quantifiable key metrics. This means taking your chosen signals and determining exactly how you will measure them. Metrics should be clear, actionable, and directly tied to your goals.
Think about how you can present your data in a way that tells a story. For example, rather than tracking a raw number of videos watched, measure the average number of videos watched per user per session. This makes it easier to spot trends and understand user behavior.
For the example above, you might track:
- CSAT (Customer Satisfaction Score) for the roadmap feature.
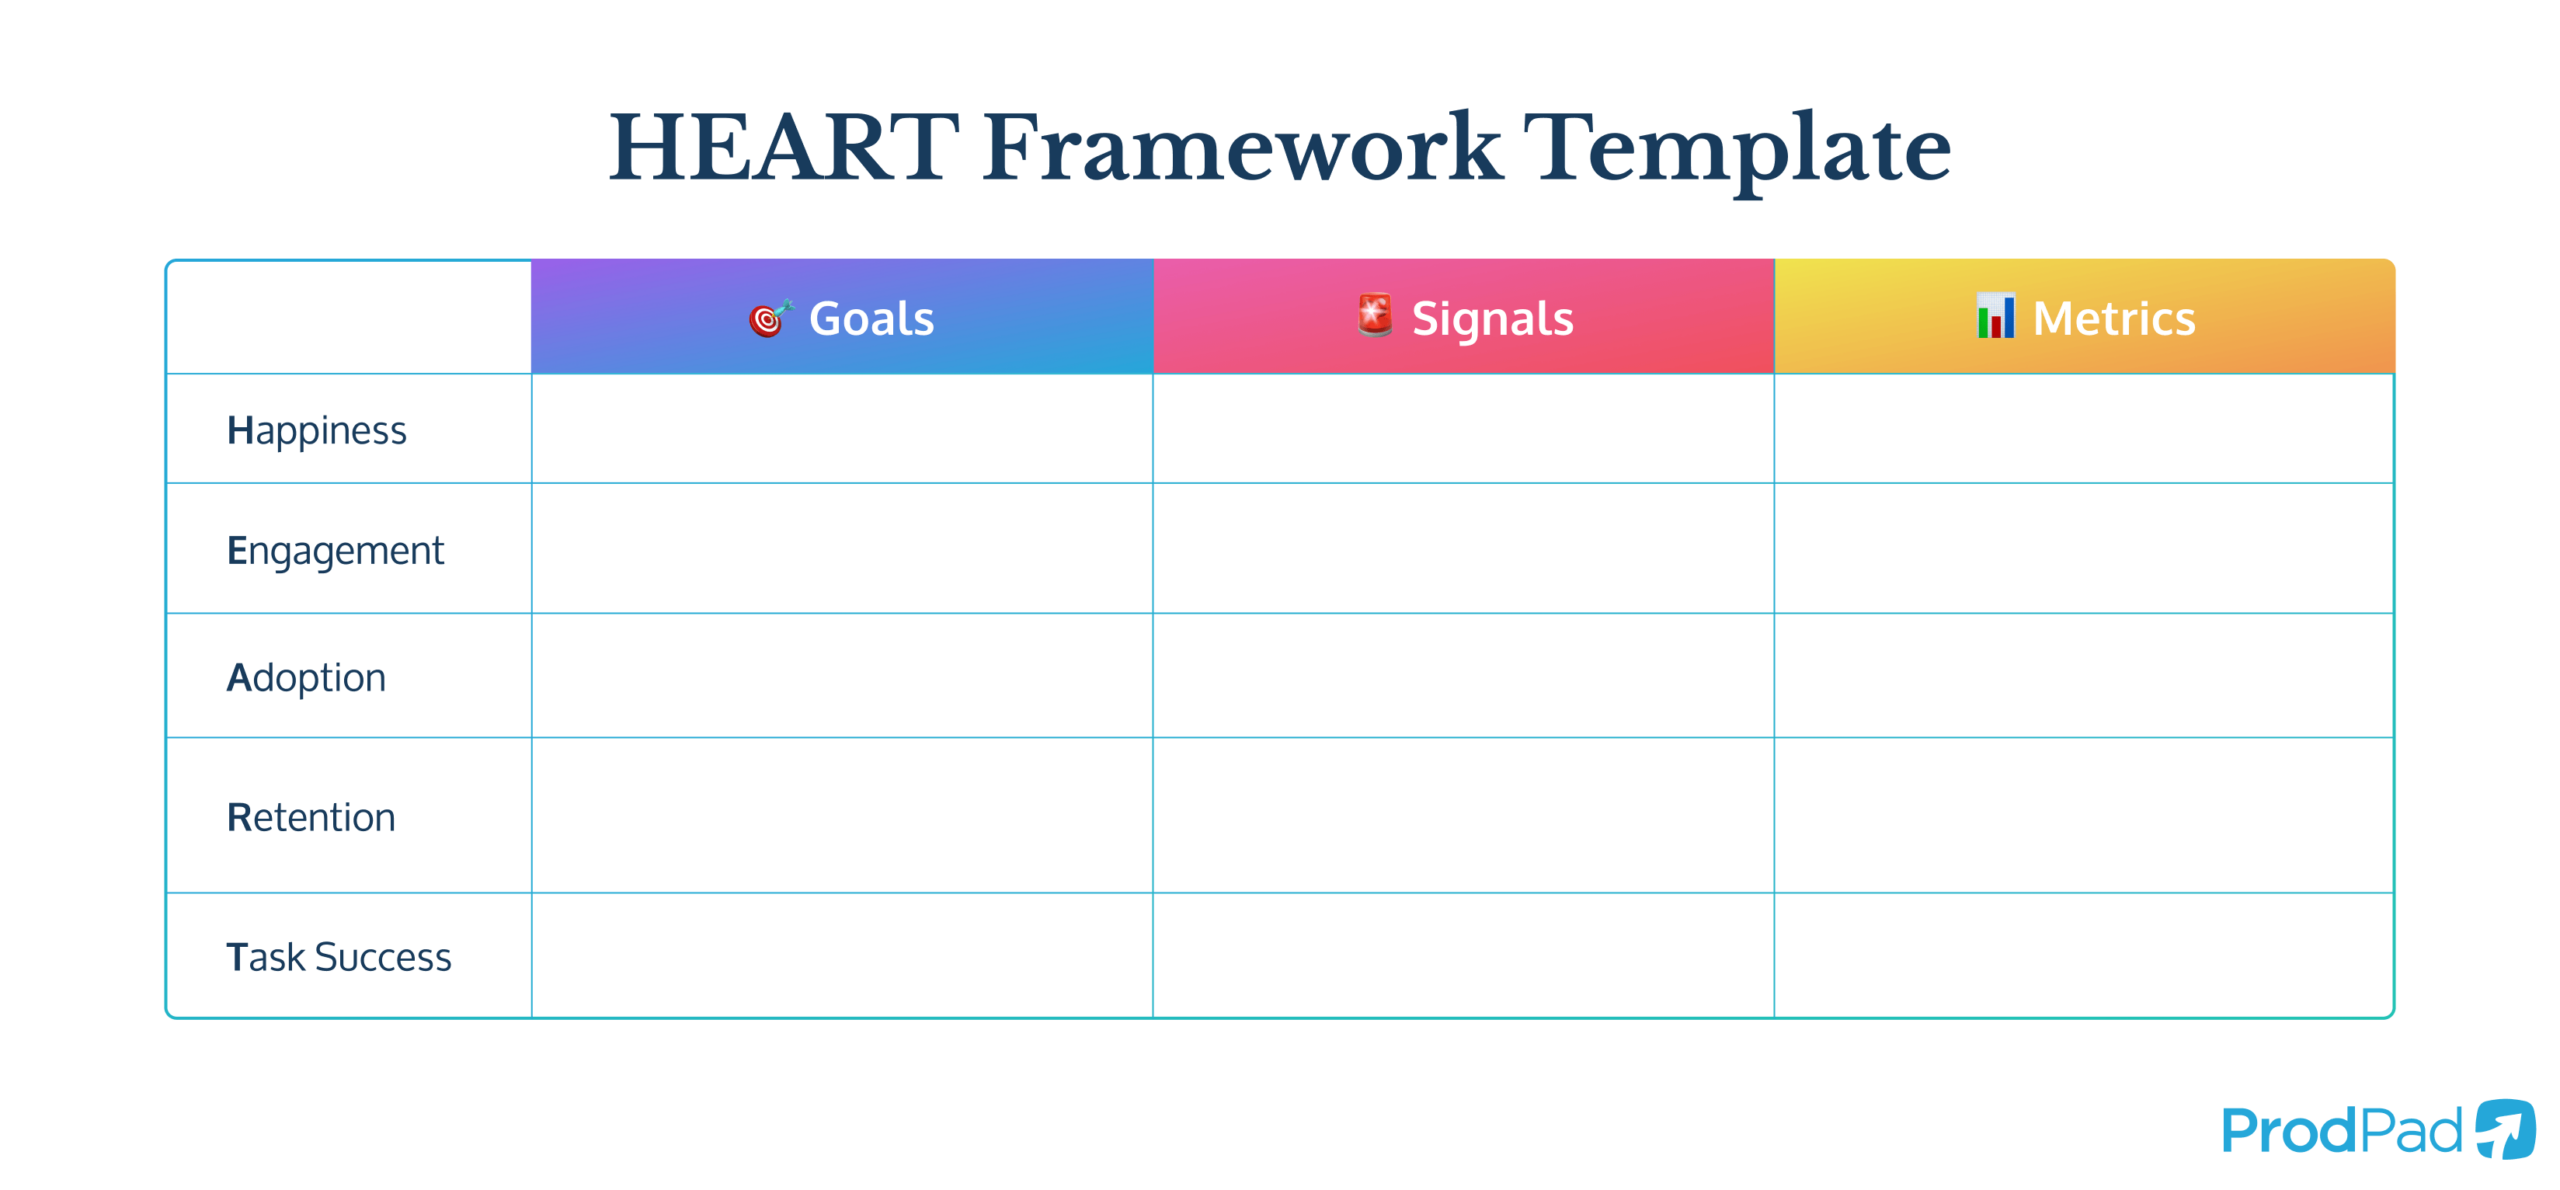
When plotting your HEART metrics, it’s useful to pop them into a table like the one below to easily map things out.
One thing to note is that you don’t have to measure all aspects of the HEART framework. Some areas may not be relevant to your product, so use it as a guide to pick the best for you.
While the HEART framework offers a comprehensive way to think about user experience, the Goals-Signals-Metrics method helps bring that vision into sharp focus with real-world, actionable data.
By starting with clear goals, identifying the right signals, and developing measurable metrics – not vanity metrics – you create a streamlined process that keeps your Product Team aligned and your product on the path to success.
What are the common mistakes when using the HEART framework?
When applying the HEART framework, it’s important to be aware of some common pitfalls that can hinder your success. Here are some frequent mistakes, and how to avoid them:
- Metric overload: Trying to track too many metrics can dilute focus and overwhelm your team. Instead, zero in on a few relevant KPIs that truly reflect your user experience goals. Remember, quality beats quantity when it comes to meaningful data.
- Being too ambitious: Setting overly broad or unrealistic goals can lead to frustration and misalignment. Start with achievable targets and build on them. By focusing on incremental improvements, you create a clear path toward long-term success.
- Doing it on your own: The HEART framework thrives on collaboration. Working in isolation can result in missed insights and a narrow perspective. Engage with your cross-functional teams – from Design teams and Engineering to Marketing and Customer Support – to ensure your goals and metrics reflect a holistic view of the user experience.
- Failing to iterate: Once you’ve established your metrics, it’s easy to think the job is done. However, the user landscape is always changing. Regularly revisit and refine your goals, signals, and metrics based on new data and evolving product needs. This iterative approach ensures your framework remains relevant and effective.
By avoiding these common pitfalls, you can harness the full power of the HEART framework. A disciplined, collaborative, and iterative approach not only keeps your team aligned but also ensures that your metrics drive actionable insights and sustainable product improvements.
Build UX your customers will love
The HEART framework is more than a guide on how to measure the success of your UX, it’s a structured way to understand how users truly experience your product. By focusing on Happiness, Engagement, Adoption, Retention, and Task Success, teams can move beyond vanity metrics and gut feelings, making data-driven decisions that enhance user satisfaction and long-term success.
But remember, just like the one pumping blood in your chest cavity, the metrics you devise from the HEART framework need to be unique to your product. That’s why it’s best to follow the Goals-Signals-Metrics approach when using the HEART framework instead of plugging in common metrics without validating if they’re right for you.
Whether you’re a UX Designer, Product Manager, or part of a cross-functional team, the HEART framework helps bring clarity to the complex world of user experience. So, next time you’re debating how to improve your product, don’t rely on your heart, use HEART to guide the way.
While we’re on the topic of setting metrics and KPIs, take it one step further by reviewing the metrics you use to analyze the performance of your product. We’ve got a whole list of product KPIs that you can use to help pick out the right ones for you.
